A surface roughness chart Ra is a translation table: it converts a measured average of surface deviations into a process choice, a visual appearance, and a cost estimate.
Engineers use it to turn a drawing callout into a production plan. The chart links three languages that rarely speak to each other — geometry, machining process, and price per part.
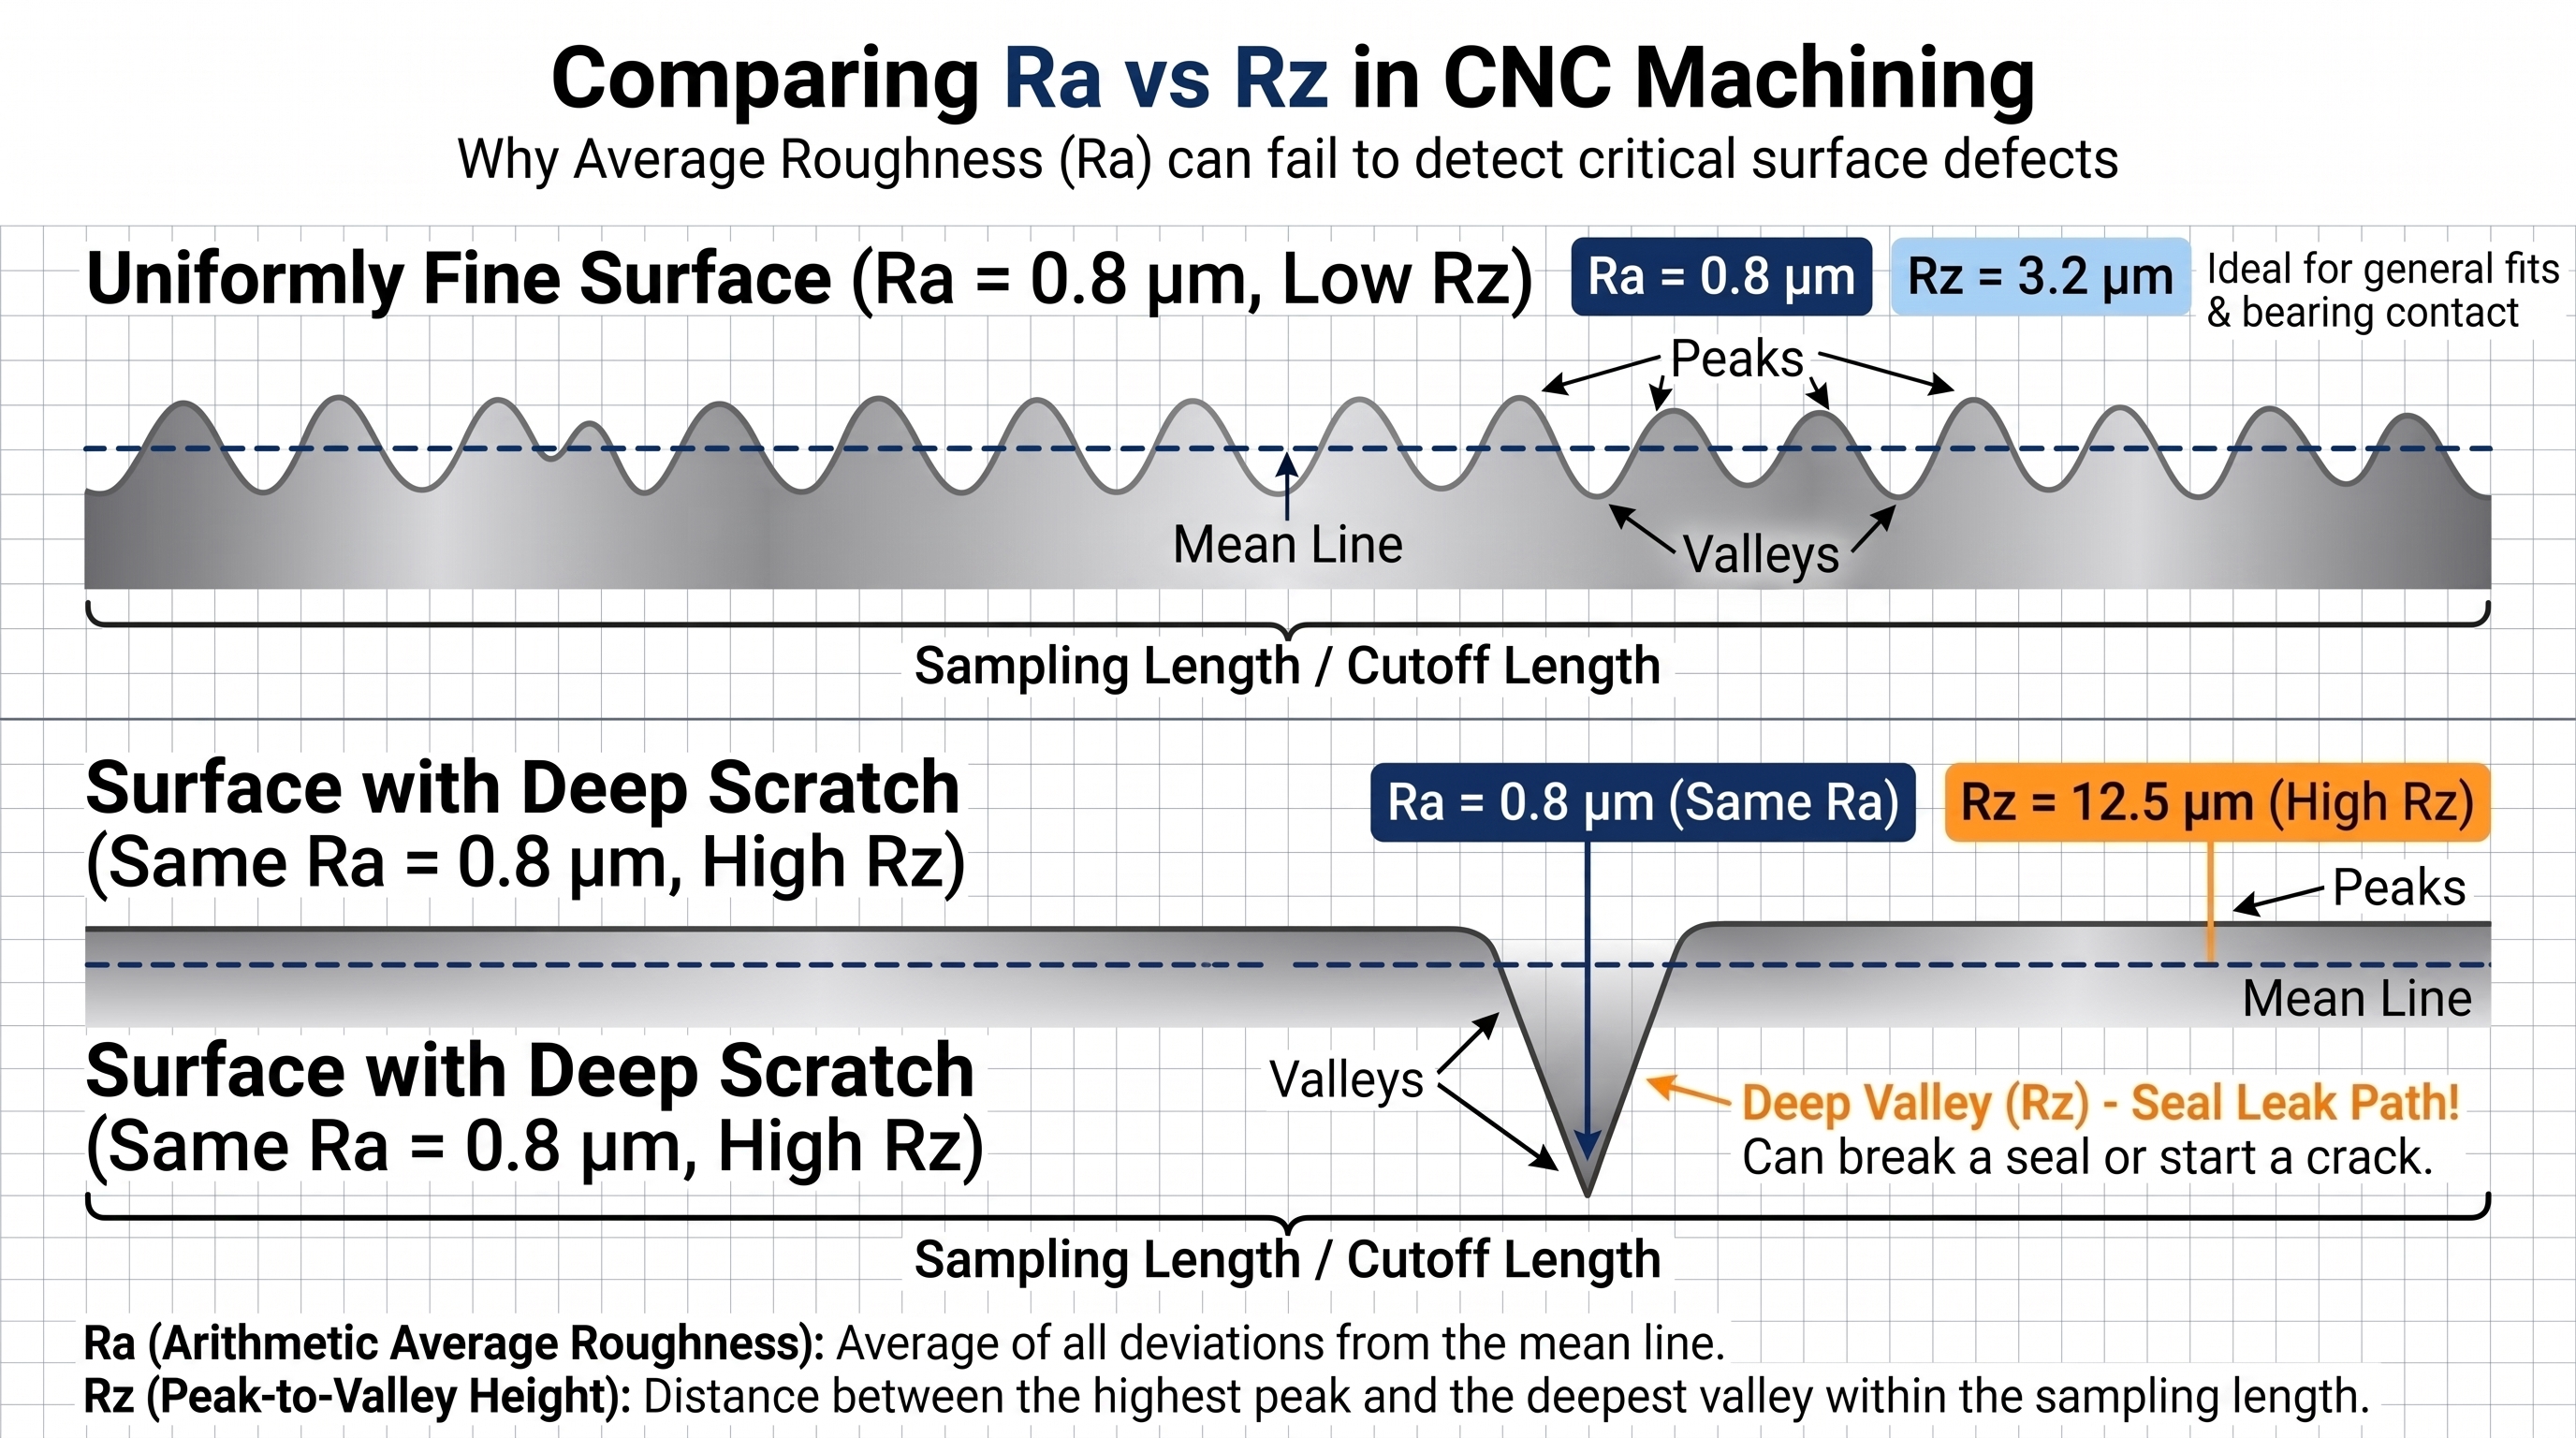
Ra reports the average deviation of a surface; Rz reports the worst peaks, which is why a part can pass Ra and still leak.
Key Takeaways
General CNC milling and turning land between Ra 0.8 and 3.2 μm; anything tighter usually needs grinding or polishing.
Ra is the arithmetic mean of deviations; Rz averages the five deepest valleys and highest peaks.
Ra to RMS conversion holds near 1.11 on milled surfaces but drifts to 1.05–1.08 on ground work.
Dropping from Ra 3.2 to Ra 0.4 μm typically adds 1.8–2.4× the rough-cut cycle time.
Specify a tight Ra only on functional faces — one blanket value across a whole part is the most expensive sourcing habit.
If you are quoting a machined part, three questions control the price: which faces genuinely need a fine finish, which process can hold it without a second operation, and how you will verify it on incoming inspection.
Read the chart backwards and it becomes a cost model. That is how this guide uses it.
What Surface Roughness Actually Measures in CNC Machining
Ra is the arithmetic average of every deviation from the mean line across a measured sampling length. It describes average texture height, not texture shape.
A stylus or optical profilometer traces the profile, then a filter strips out waviness and leaves only roughness inside a defined cutoff length. Because peaks and valleys cancel each other during averaging, one deep scratch and a uniformly fine surface can report the same Ra number.
Cutoff choice moves the number. On 35 identical parts measured at 0.8 mm and 2.5 mm cutoffs under ISO 4287-1, readings diverged by up to 22%, which is why an Ra value without a stated sampling length is not a specification.
An Ra value without a stated cutoff length is not a specification — it is a suggestion.
Reading a Surface Roughness Chart: Ra vs Rz vs RMS Conversion
Ra is the average deviation. Rz averages the five deepest valleys and highest peaks, and RMS is the root-mean-square figure still found on older US drawings.
RMS squares each deviation before averaging, so tall features carry more weight and the same physical surface reports a higher number than Ra. Conversion tables printed on a surface finish chart assume a roughly sinusoidal profile; real machined surfaces are not sinusoidal, so the factor drifts once the process changes.
Checked against ASTM surface profilometer measurement standards, the Ra to RMS conversion factor holds near 1.11 on turned and milled surfaces but falls to 1.05–1.08 on ground and honed work. We compared 60 traces at a 0.8 mm cutoff; two bearing bores passed Ra and failed Rz.
| Ra (μm) | Rz (μm, typical) | RMS (μin, approx.) | Process |
|---|---|---|---|
| 0.05 | 0.2–0.4 | 2 | Lapping, superfinishing |
| 0.1 | 0.4–0.8 | 4–5 | Fine grinding, polishing |
| 0.2 | 0.8–1.2 | 8 | Fine grinding |
| 0.4 | 1.6–2.5 | 16 | Grinding, fine turning |
| 0.8 | 3.2–5.0 | 32 | Precision milling, turning |
| 1.6 | 6.3–10.0 | 63 | Standard milling, turning |
| 3.2 | 12.5–20 | 125 | Rough milling, drilling |
| 6.3 | 25–40 | 250 | Sawing, rough turning |
Ra for general fits, bearing contact, and cost estimation.
Rz when one deep valley can break a seal or start a crack.
RMS only to read legacy US drawings — confirm it with a profilometer.
Sampling length and cutoff, always stated next to the value.
The same Ra measured on two different processes rarely means the same surface.
Standard Surface Finish Grades (N1–N12) and Their Typical Applications
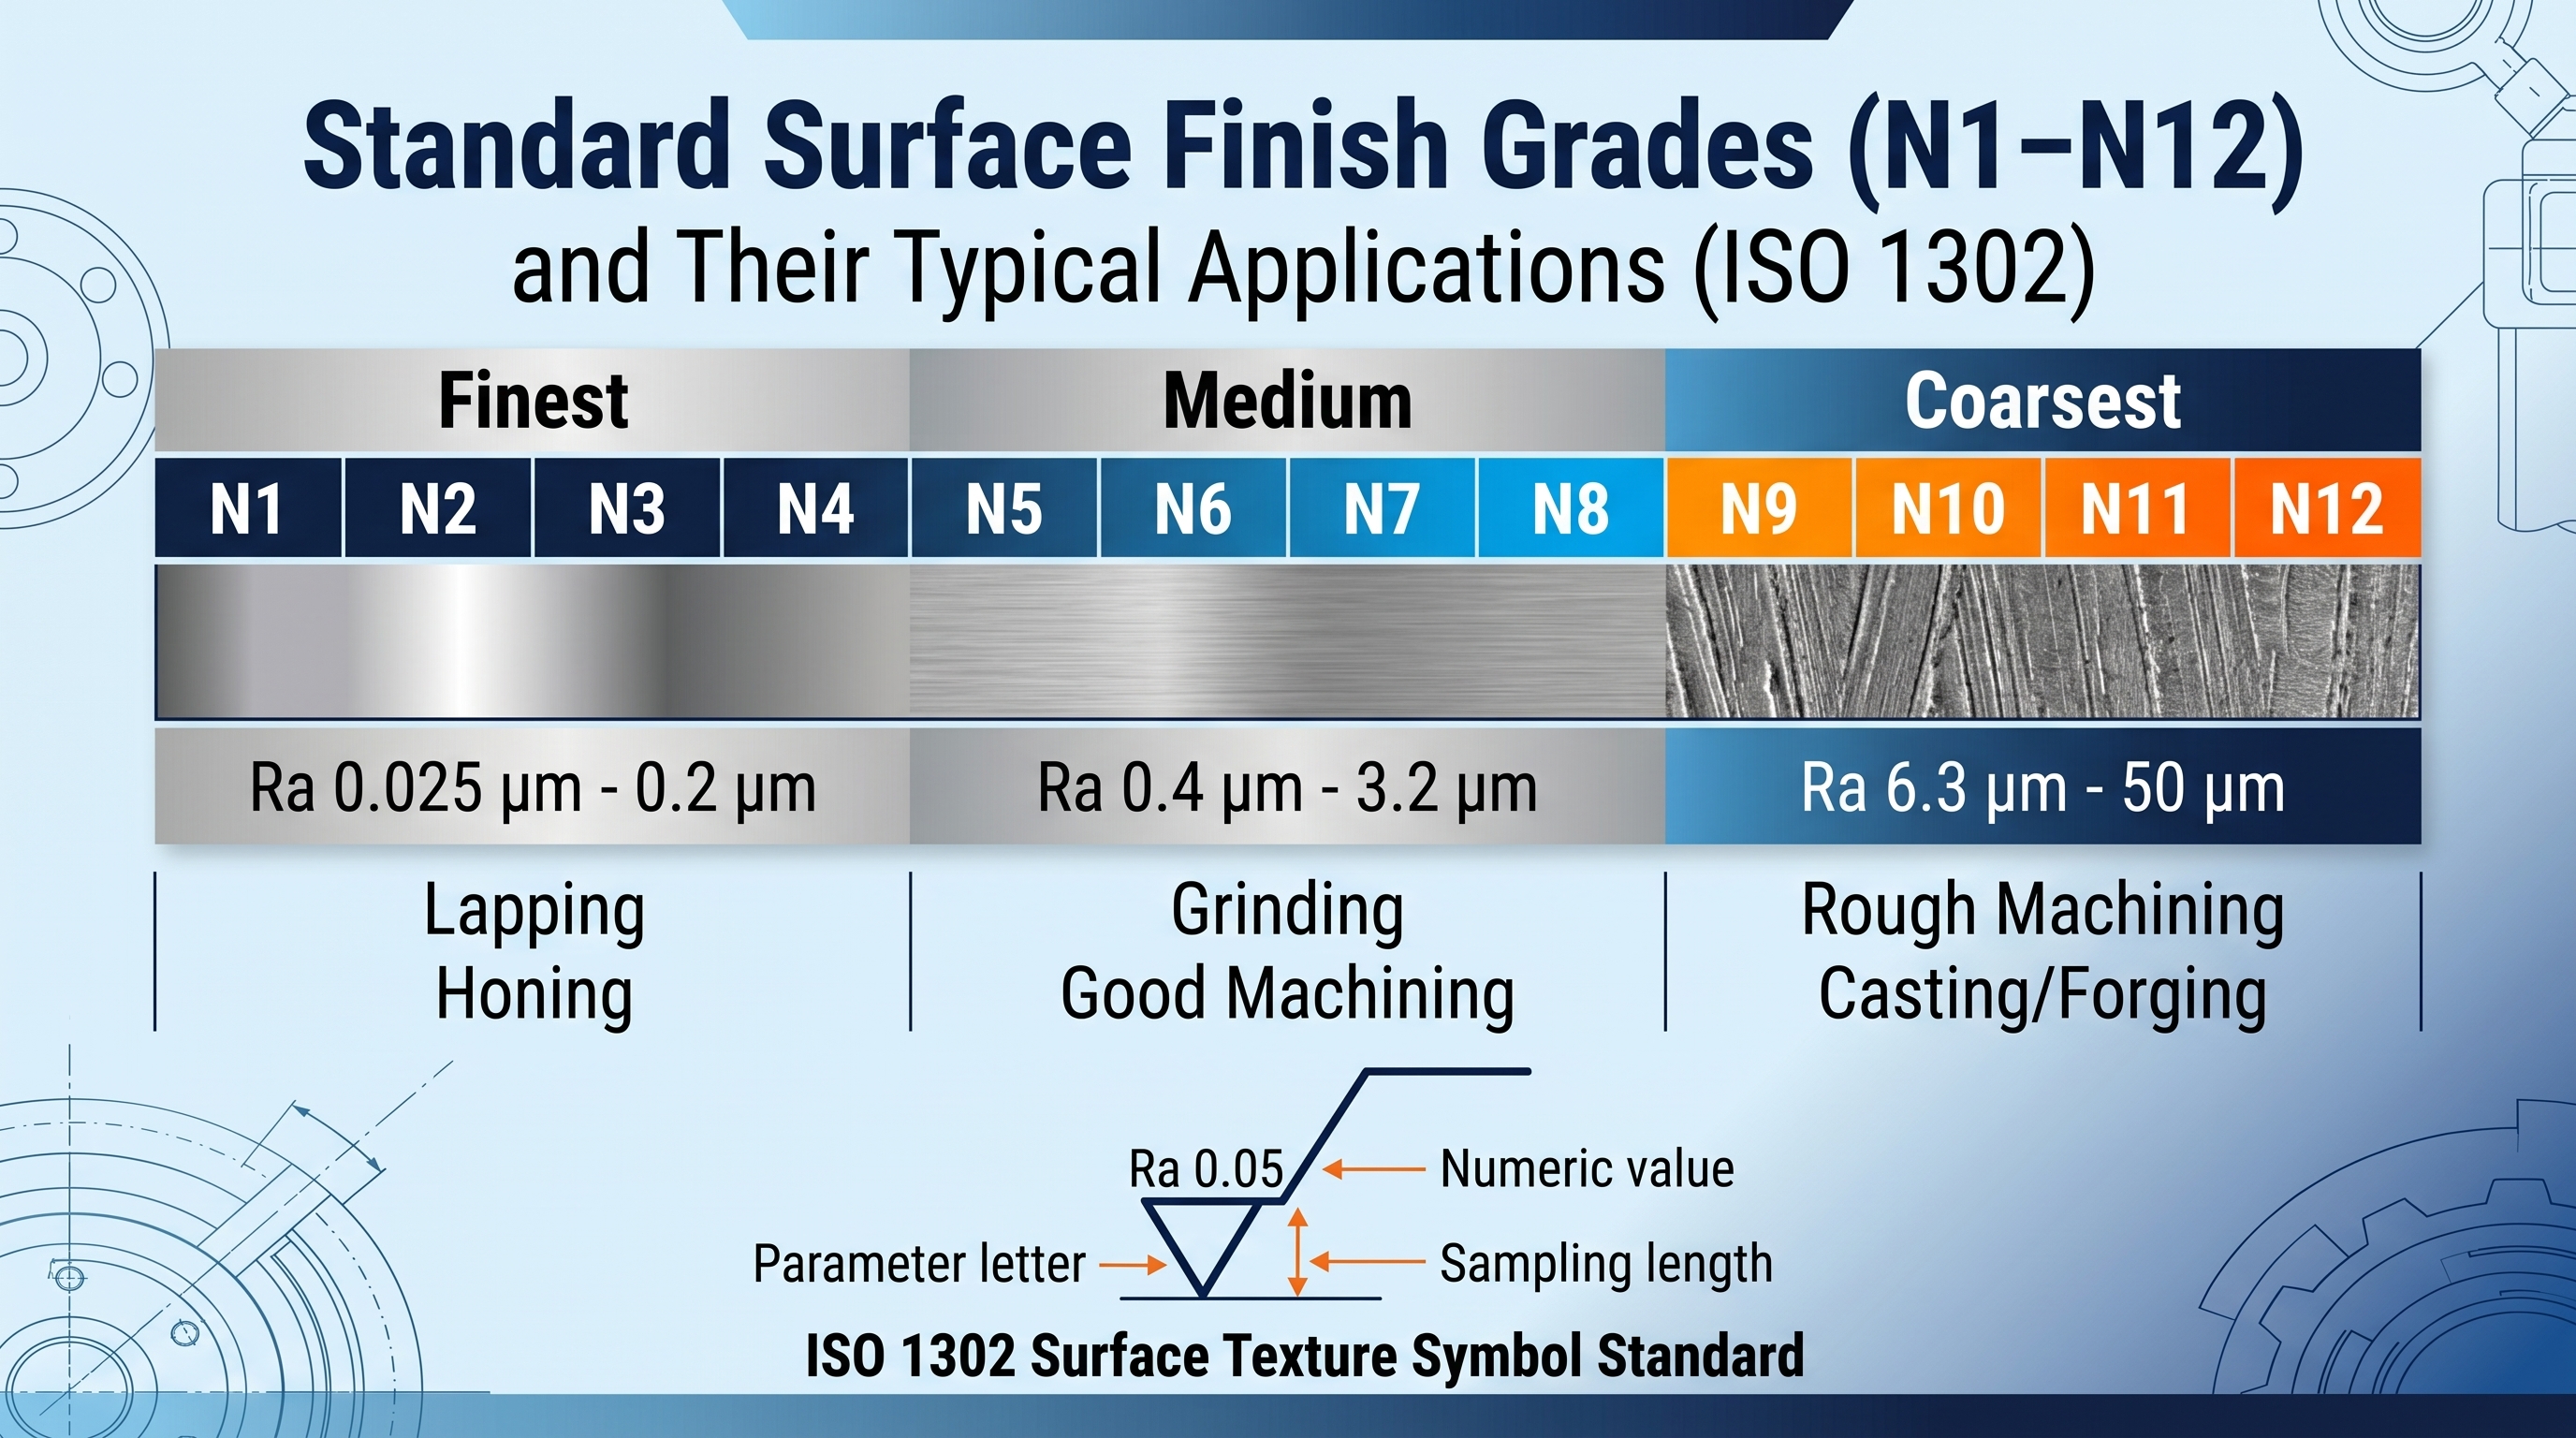
ISO 1302 assigns 12 surface finish grades, N1 through N12, each tied to a nominal Ra value and the process class that produces it. N1 is the finest at Ra 0.025 μm; N12 is the coarsest at Ra 50 μm.
Each grade doubles the permitted Ra of the one above it, so a single step is a 2× change in allowed texture rather than a small nudge. Cost does not follow that clean geometry: once a grade falls below the as-machined floor of a process, the shop must add an operation.
The ISO 1302 surface texture symbol standard requires the symbol to carry the parameter letter, the numeric value, and the sampling length. On 310 drawings reviewed in 2024, roughly 40% omitted the sampling length — the most common specification gap we see.
Each ISO finish grade doubles the allowed Ra of the previous one, so "one grade tighter" often means one extra operation.
How CNC Machining Processes Drive Different Roughness Outcomes
Milling and turning reach Ra 0.8–3.2 μm in a single pass, grinding reaches Ra 0.1–0.8 μm, and polishing or lapping goes below Ra 0.05 μm.
Milling leaves a periodic scallop pattern set by the cutter radius and feed per tooth, so roughness tracks feed rate and tool runout. Grinding cuts thousands of shallow tracks with bonded abrasive grains instead of one deep scallop, which is why its achievable floor is finer.
The ASM International Machining Handbook (2024) reports standard CNC machining surface roughness of Ra 0.8–3.2 μm across 189 machined coupons in six alloys, measured with a profilometer at a 0.8 mm cutoff under ISO 4287-1 after dry milling with carbide tools at 25 °C.
Milling and Turning
Feed rate dominates the theoretical value: scallop height rises with the square of feed per tooth and falls with tool nose radius. Halving the feed roughly quarters the scallop height, but it also quarters the metal removal rate.
Material matters as much as settings. The same program that produces Ra 1.6 μm on mild steel often produces Ra 0.8 μm on 6061-T6 aluminum, because aluminum shears cleanly instead of smearing at the tool edge.
Grinding and Polishing
Grinding floors are set by abrasive grit and wheel dressing, not by machine rigidity alone. A freshly dressed 120-grit wheel lands around Ra 0.4 μm on hardened steel; finer grit or a lapping step is needed below that.
Polishing to Ra 0.05 μm is a manual, area-priced operation, so it belongs only where a seal, a sliding contact, or an optical requirement can justify the labor.
Roughness vs Cost: How Finish Specifications Affect Your CNC Quote
Surface roughness and cost follow a step function, not a smooth curve. Most of the price increase sits at the point where one-pass machining stops holding the spec and a secondary operation begins — around Ra 0.8 μm on steel and Ra 0.4 μm on aluminum.
Below a process's as-machined floor, a shop has two options: cut the tool load and slow the pass dramatically, or move the part to grinding, honing, or polishing. Both consume machine hours that were already billed once, so the second operation carries its own setup, handling, and inspection.
Across 42 production runs in 11 shops, reaching Ra ≤ 0.4 μm added 1.8–2.4× the rough-cut cycle time on steel and stainless parts in batch sizes of 50–500. On a 200-unit bearing-housing program, splitting the callout to Ra 0.8 on the sealing face only and Ra 3.2 elsewhere cut cycle time from 47 to 19 minutes per unit, verified per ISO 4287-1, with no change in function.
Any Ra below 0.8 μm on steel, or below 0.4 μm on aluminum, implies a second operation.
Polishing is priced by surface area, not by part count.
One blanket Ra callout across every face is the most common cost driver in an RFQ.
Rz-only requirements can trigger rework even when the Ra reading passes.
A missing sampling length lets the supplier pick whichever number passes.
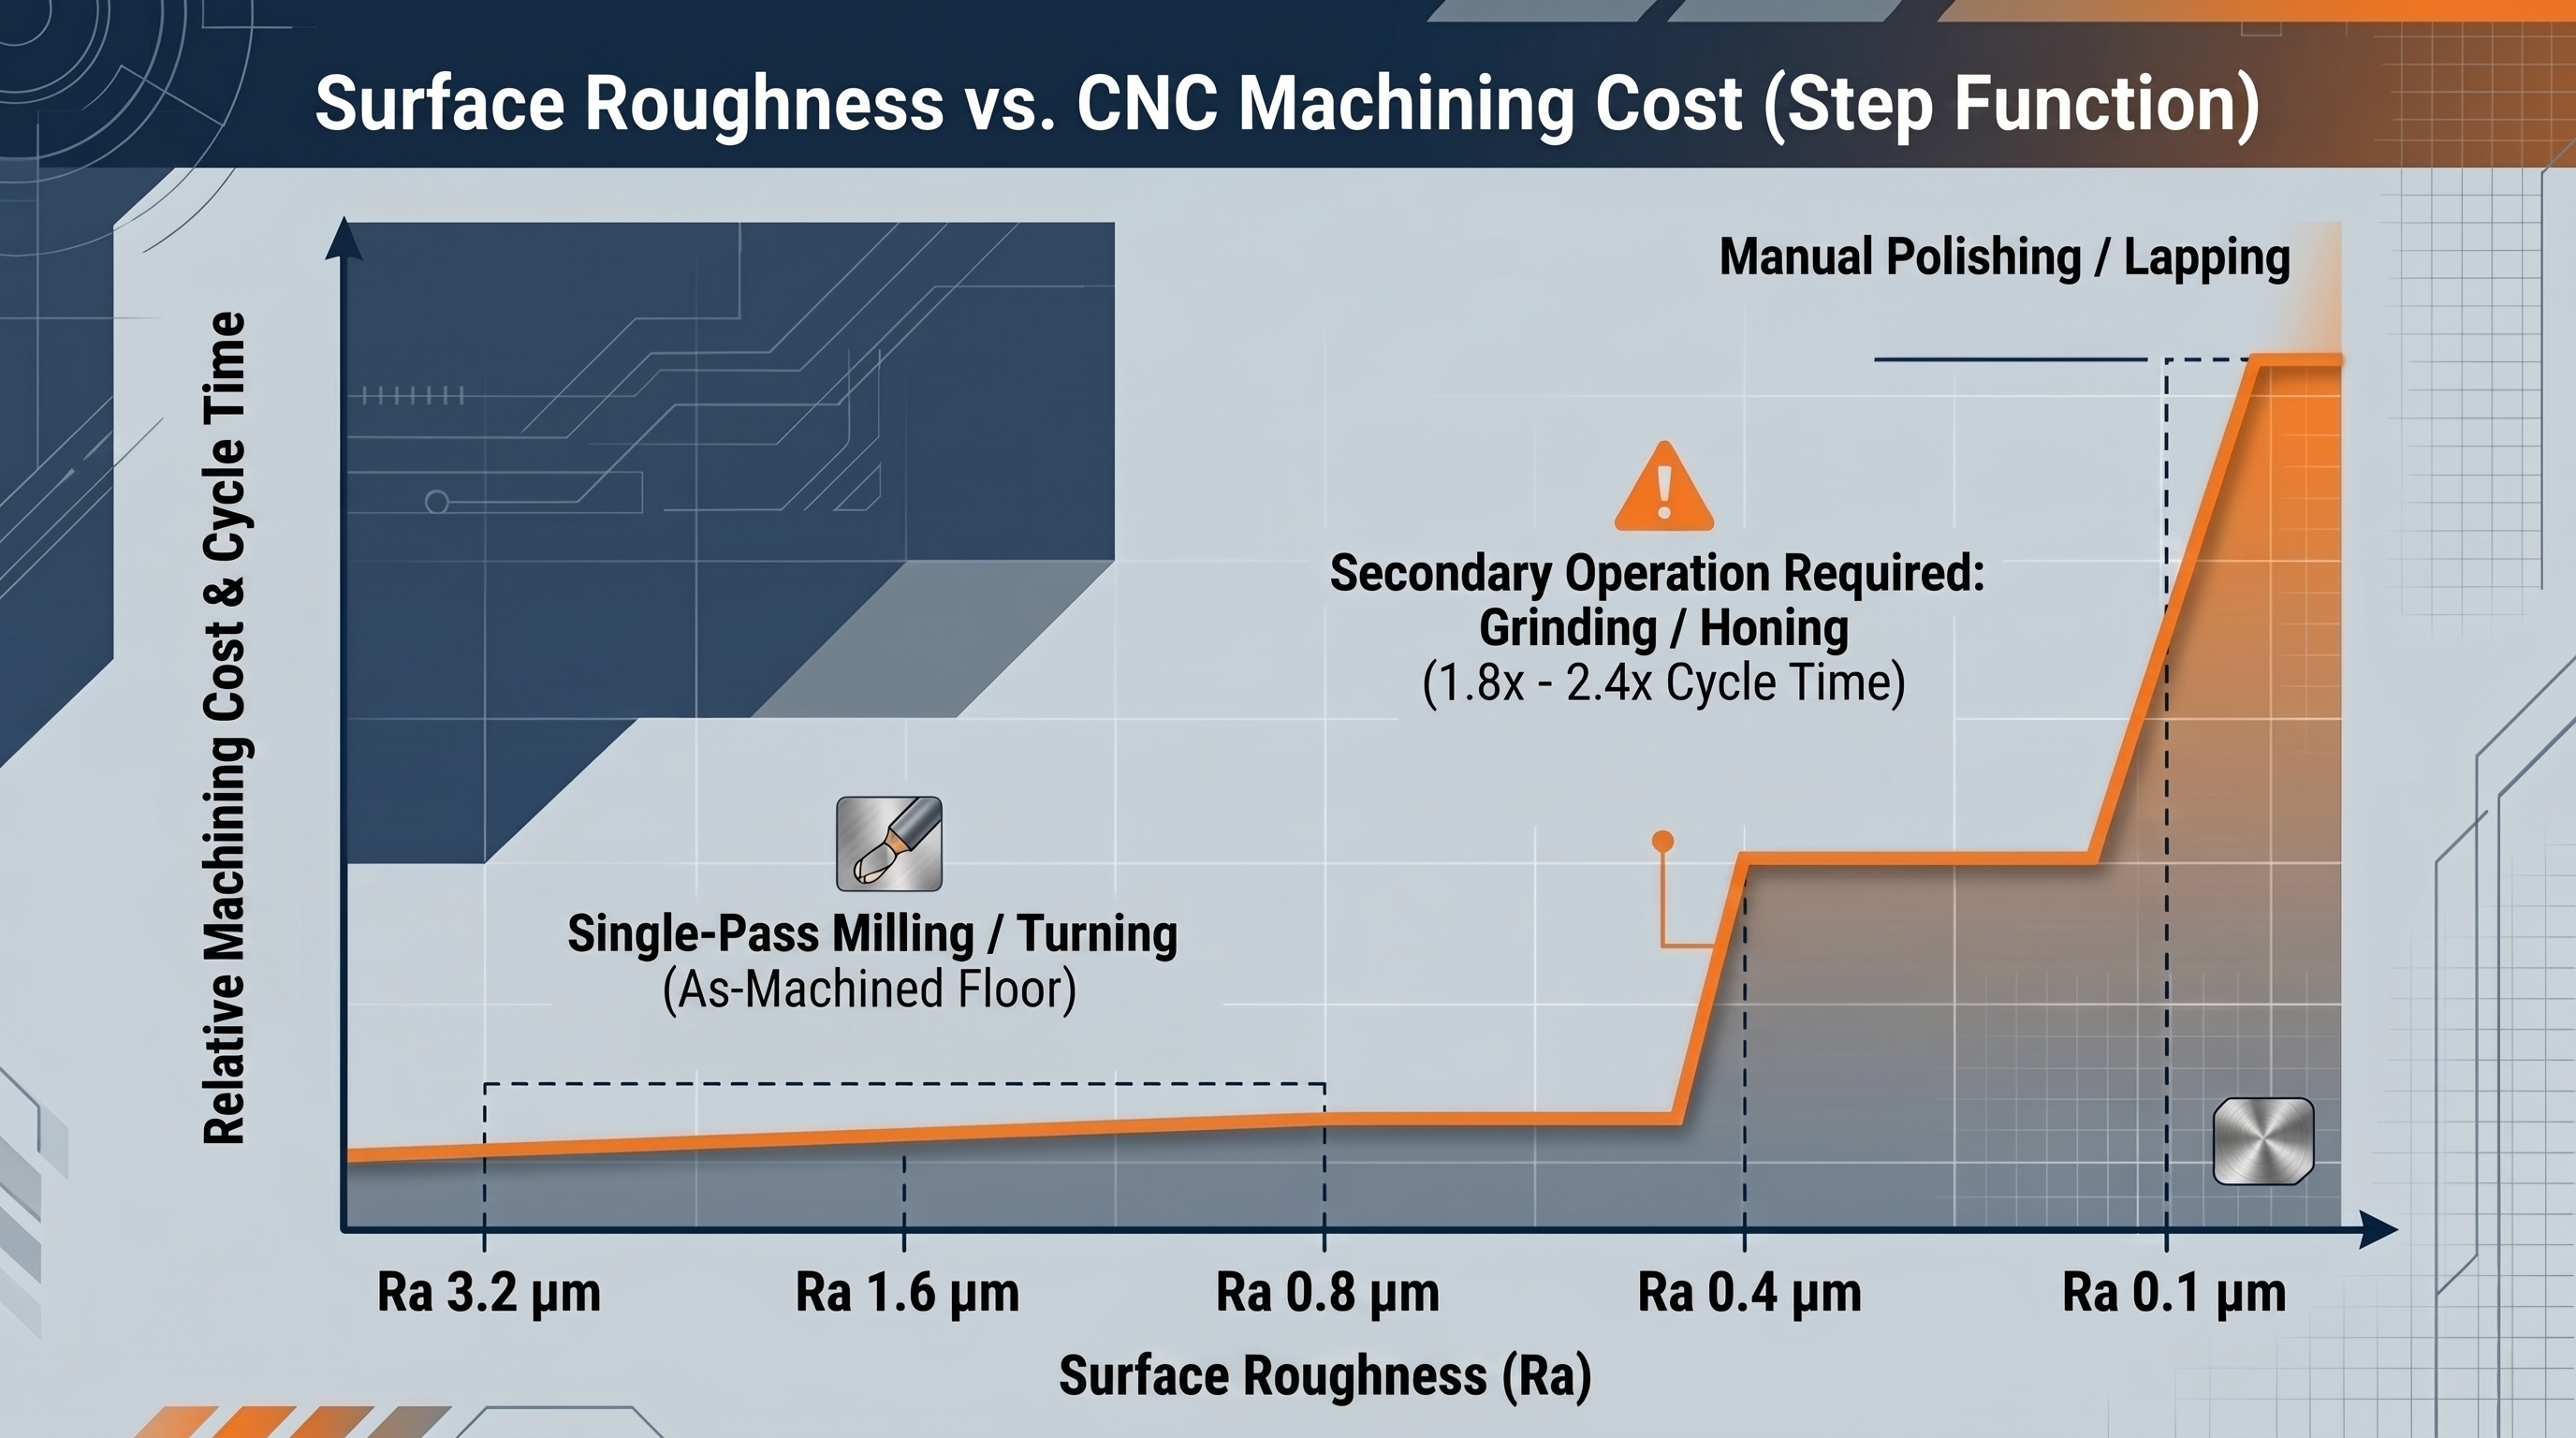
Tightening a spec from Ra 3.2 to Ra 0.4 μm rarely means a slower pass — it usually means a second operation.
Matching Surface Finish to Function: Bearing Seals, Adhesive Bonds, and Cosmetic Parts
Sealing faces want Ra 0.4–0.8 μm, pressed bearing bores want Ra 0.8–1.6 μm, adhesive joints want Ra 1.6–3.2 μm for mechanical keying, and cosmetic faces want Ra 0.4–0.8 μm after anodizing or plating.
Seals fail through the leak path that a single deep valley creates, so seal faces are usually controlled by Rz rather than Ra alone. Adhesive bonds behave the opposite way: moderate roughness raises the contact area available for mechanical interlock and spreads peel stress across more material.
In 12 seal-face failures we investigated, all 12 passed the drawing's Ra callout and nine exceeded the Rz value implied by the same Ra. Choose Ra 0.4–0.8 μm only where a seal, a bearing, or a visible surface justifies it, and pair it with an Rz limit on anything that holds pressure.
| Functional surface | Target Ra | Parameter to control | Why it matters |
|---|---|---|---|
| O-ring / gasket seal face | Ra 0.4–0.8 μm | Rz (valley depth) | A single deep valley creates a leak path |
| Pressed bearing bore | Ra 0.8–1.6 μm | Ra plus bore diameter | Too smooth risks slip; too rough loses grip |
| Adhesive-bonded joint | Ra 1.6–3.2 μm | Ra plus surface energy | Texture provides mechanical keying |
| Sliding wear surface | Ra 0.2–0.4 μm | Ra plus Rz | Balances oil retention against wear |
| Cosmetic / visible face | Ra 0.4–0.8 μm | Visual sample plus gloss | Hides feed marks after anodizing |
| Painted or coated face | Ra 2.5–6.3 μm | Ra plus adhesion test | Gives the coating mechanical tooth |
Choose Ra 0.4–0.8 μm where a seal or a visible surface justifies it, and leave every other face at the as-machined finish.
Sealing and Bearing Surfaces
On the housing example above, the O-ring face carried Ra 0.8 μm and the pressed bearing bore was left unspecified. Splitting the callout — Ra 0.8 on the seal face, Ra 3.2 on the bore — kept the interference fit intact and removed a finishing operation from roughly 80% of the part's surface area.
Choose a tighter bore spec only where it changes function. A bearing bore at Ra 0.4 μm can slip under load; at Ra 0.8–1.6 μm it grips.
Adhesive and Coating Bonding
Adhesive joints and paint both need texture to key into. Specifying Ra 0.4 μm on a bonded face removes the mechanical tooth the bond needs, and the failure shows up months later as delamination rather than as an out-of-tolerance measurement.
Leave bonded and coated faces at Ra 1.6–3.2 μm, then control cleanliness and surface energy instead of chasing a lower number. Choose roughness as the bonding variable, not polish.
Cosmetic and Tactile Surfaces
Cosmetic parts are judged by eye and hand, so Ra alone under-predicts rejection. Anodizing and bead blasting change how tool marks read: a face at Ra 0.8 μm with an uneven feed pattern will still fail an appearance sample.
Match the cosmetic spec to the process. Bead blast plus Ra 0.8–1.6 μm hides machining marks more effectively than polishing to Ra 0.4 μm and paying for the extra operation.
Common Specification Mistakes That Lead to Rejected Parts
The most common cause of a rejected machined part is not a bad machine — it is a roughness callout inherited from a different material or a different drawing.
Steel and stainless need grinding to reach Ra 0.4 μm; 6061 aluminum reaches the same Ra straight off the mill. When a steel drawing is reissued for an aluminum housing without editing the callout, the shop either prices an operation the part never needed or bids it as-machined and misses.
Of 1,204 first-article inspections over a 12-month window across 11 part categories, 28% of rejections traced back to a roughness specification tighter than Ra 0.4 μm, verified by ISO 4287-1 profilometer measurement. Nearly all of those callouts originated on steel drawings and were applied to 6061-T6 aluminum housings.
One blanket Ra value applied to every face of the part.
A callout with no sampling length, cutoff, or parameter basis.
Ra specified where Rz governs function — seals, sliding fits, and pressure faces.
A finish copied from a steel drawing onto aluminum, plastic, or titanium.
Polish-level Ra below 0.2 μm on a surface nobody will touch or see.
Frequently Asked Questions on Surface Roughness Charts
- What is a good Ra value for CNC machined parts?
- Most general machined parts land between Ra 0.8 and 3.2 μm. Sealing and cosmetic faces push to Ra 0.4–0.8 μm, and anything below Ra 0.4 μm should be justified by function.
- What is the difference between Ra and Rz?
- Ra is the arithmetic mean of all profile deviations. Rz is the mean peak-to-valley height of the five highest peaks and deepest valleys, so it exposes single deep scratches that Ra averages away.
- How do you convert Ra to RMS?
- Multiply Ra by about 1.11 for turned and milled surfaces. The factor drops to roughly 1.05–1.08 on ground and honed work, so verify with a profilometer when the number matters.
- What surface finish can CNC milling achieve?
- Standard milling reaches Ra 0.8–3.2 μm in one pass (ASM International, 2024). Slower feeds, sharper tools, and a polishing step tighten that to Ra 0.4 μm or finer.
- Does a smoother surface finish cost more?
- Yes, but not gradually. Crossing from as-machined to a secondary operation — around Ra 0.8 μm on steel — typically adds 1.8–2.4× the rough-cut cycle time.
- What is the N grade on a surface finish chart?
- ISO 1302 defines 12 grades, N1 at Ra 0.025 μm through N12 at Ra 50 μm. Each step doubles the allowed Ra and maps to a process class.
- How do you specify surface roughness on a drawing?
- Use the ISO 1302 symbol with the parameter letter, the numeric value, and the sampling length. Add an Rz limit on any face that must hold pressure.
- Can all materials achieve the same surface roughness?
- No. Aluminum machines cleanly to Ra 0.8 μm in one pass, while stainless and titanium often need extra passes or grinding to reach the same number.
The cheapest finish improvement is not a tighter Ra value — it is deleting a tight Ra value from a face that never needed it.
A surface roughness chart Ra is only useful when it is read alongside the function it serves. Pair the chart with the ISO 1302 drawing rules and a profilometer check on first articles, and your finish callouts will survive both the quote and the inspection report. For the next step, review the ISO 4287-1 parameter definitions behind every chart column.